


This autumn sees the return of primary school progress measures after a two-year hiatus. The previous two year 6 cohorts were not assessed at key stage 1 due to the pandemic, which meant progress could not be measured in 2024 or 2025. No baseline; no progress. But the 2025/26 year 6 cohort had key stage 1 results, and the accountability machine is now firing on all cylinders again. The recently published Ofsted IDSR contains the full range of attainment and progress measures for the first time since 2023, and the primary accountability technical guidance has been updated with the changes to the methodology, so it’s a good time to re-familiarise ourselves with how these critical measures work.
The first thing to note is, the methodology is fundamentally the same: a pupil’s key stage 2 score is compared to the national average key stage 2 score of pupils with the same prior attainment. This post explains how this works in broad terms using a simple race analogy, which may help to clarify the concept for key audiences such as governors and parents. But teachers – and particularly senior leaders – need to have a good understanding of the nuts and bolts of these measures, which can be broken down into four main areas:
- Calculating key stage 1 average point scores
- Calculating pupil progress scores
- Calculating school progress scores
- Establishing whether the school progress score is statistically significant
Calculating Key Stage 1 average point scores
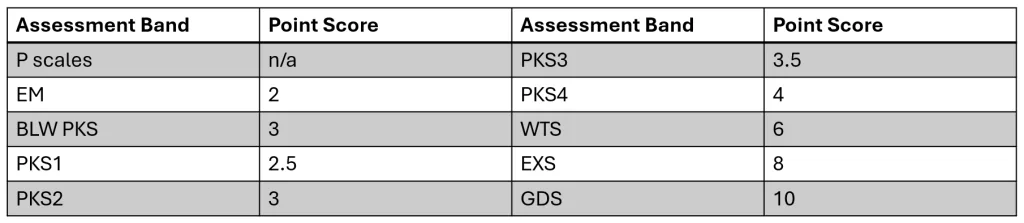
The first thing we need to do is calculate each pupil’s KS1 average point score (APS). It is important to note that if a pupil does not have KS1 results for any reason – they moved to England after year 2, they were homeschooled, or were in the private sector – they will not be included in the progress measures. They are not assigned a baseline in lieu of missing KS1 results. Each possible KS1 result in reading, writing and maths has an associated score, which is shown in the following table.
Note that p scales were not a valid outcome at KS1 for the 2026 year 6 cohort having been phased out by the time they were assessed in 2022. I’m not entirely sure what the ‘below pre-key stage’ option is for and why it has a higher point score than the lowest pre-key stage band, but it’s in the guidance document, so I’ve listed it here. I suspect it applies to very few pupils.
Now that we have point scores for the KS1 assessments, we can calculate each pupil’s APS, but it’s not straightforward mean; maths is double-weighted to give it an equal weighting with English, which has two components. The calculation is therefore:
((reading+writing)/2)+maths)/2
or more simply:
(reading+writing+maths+maths)/4
This is done for every pupil and once we have that we can place them into the broad low, middle, and high prior attainment bands we see referred to in the IDSR, ASP and school performance tables. These bands are established as follows:
- Low prior attainment: pupils with KS1 APS < 6.5
- Middle prior attainment: pupils with KS1 APS 6.5 to 8
- High prior attainment: pupils with KS1 APS > 8
Note: the DfE made a mistake in the tables checking data, including pupils with a KS1 APS of 8 (EXS in all subject at KS1) in the high prior attainment band. They should be in the middle band and this will be corrected in published statistics in December. This error does not affect progress measure calculations, which is based on a finer categorisation.
KS1 APS also allows us to place pupils into narrower set of 19 prior attainment groups, which are essential for the calculation of progress.
Calculating pupil progress scores
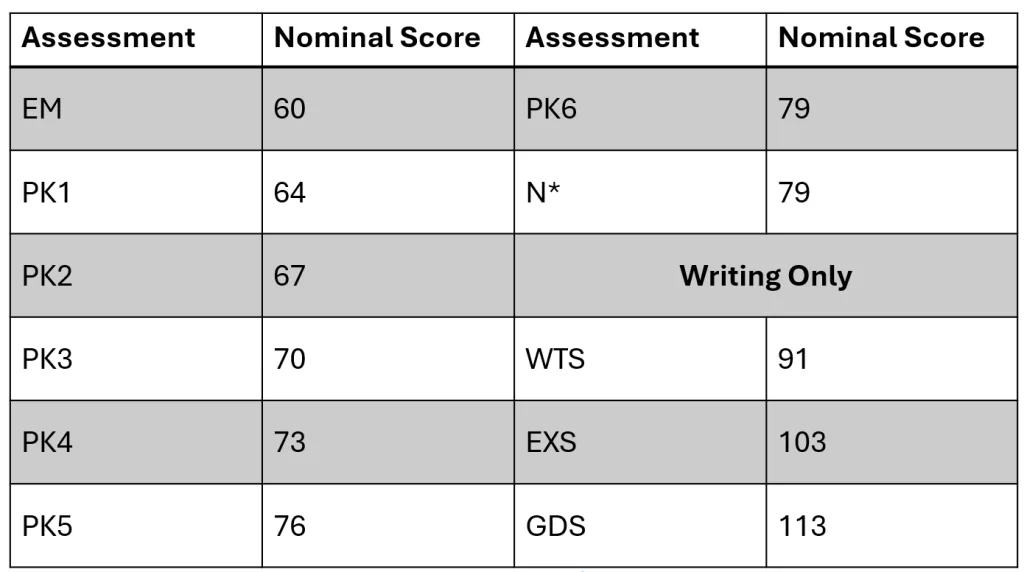
Now we need to compare each pupil’s KS2 score to the national average score of pupils in the same prior attainment group. In most cases, the KS2 result is an actual scaled score derived from a test, but in writing – for which there is no test – and for pupils who are working below the standard of the tests, the DfE have come up with a system of nominal scaled scores to fill the gaps. These are shown in the following table:
We can now calculate pupils’ individual progress scores in each subject by comparing their KS2 scaled score (or nominal score) in each subject to the average score of their prior attainment group, as listed in the table below. The pupil progress score is the difference between these two scores.
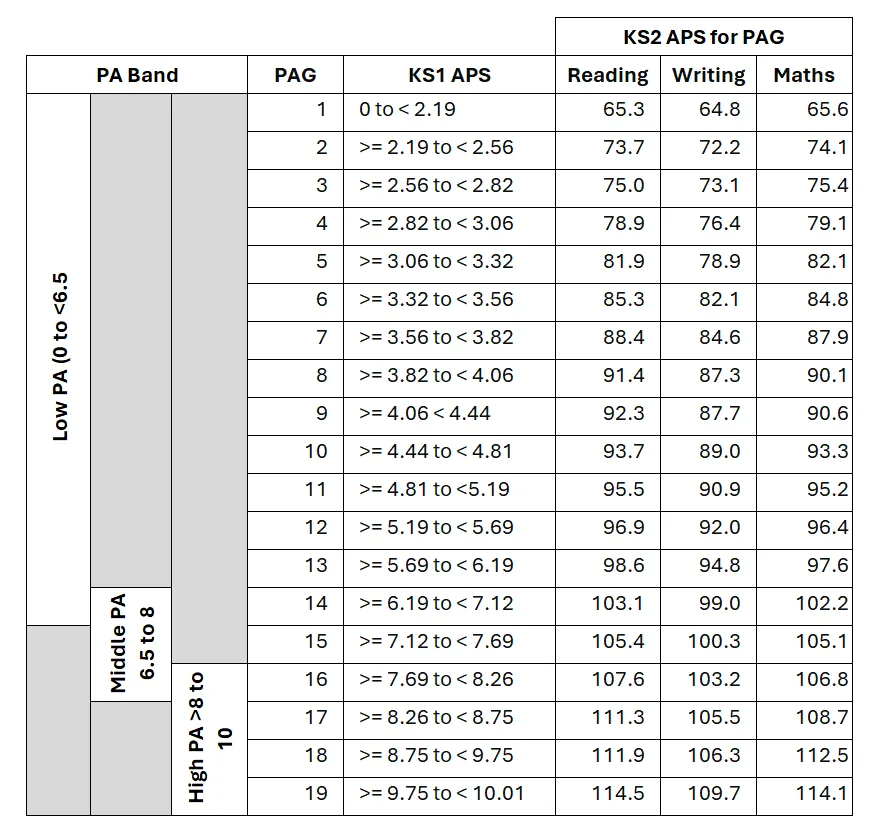
The average scores in each subject – sometimes referred to as benchmarks – are copied from the latest primary accountability guidance and change every year. This is an important point – it means that we can’t reuse them next year to try to predict progress scores before they are published. Or rather, we could use them, but the averages can change quite considerably each year so should only ever be used as a guide when applied to the next year’s cohort. Because of continued improvements in results since the pandemic, 2026 averages are around 2 points higher than 2023 equivalents for many prior attainment groups.
Calculating school progress scores
This is the easy bit! The school progress score is the average of the pupil progress scores, and any pupil who lacks a valid KS1 or KS2 result is omitted from the calculation. In the following example, 16 out of the 19 pupils in the cohort have progress scores; the school progress score is therefore the average of the 16 scores. The remaining three pupils are not included. Those three pupils may not have KS1 results or may have a KS2 code – a letter code such as A, M, Q, T, U, Z, F or P – that cannot be assigned a nominal score.
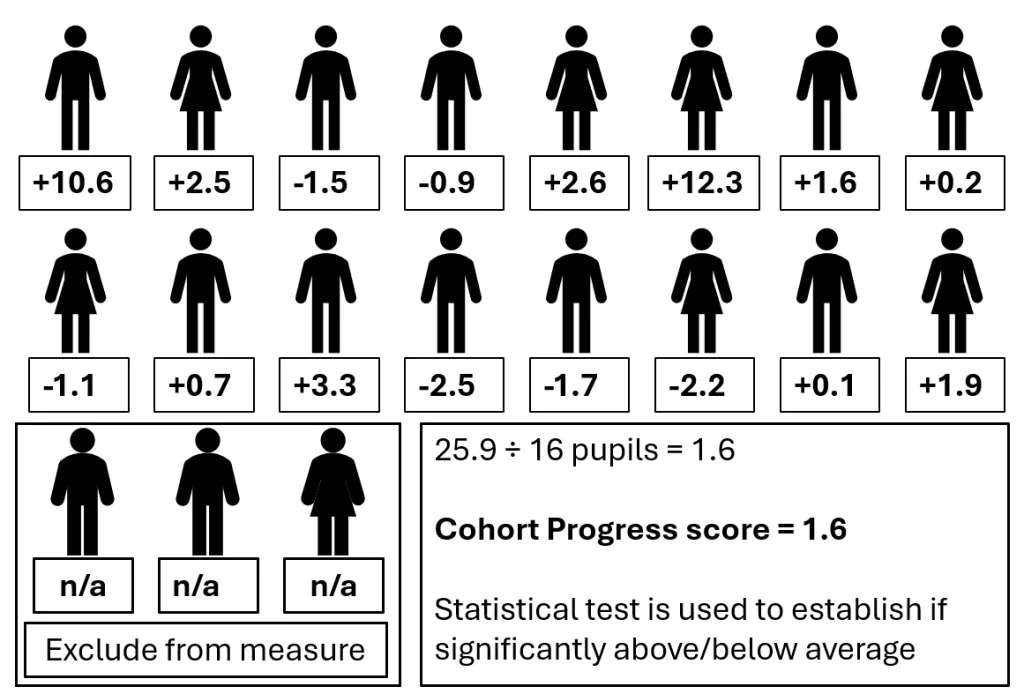
Some pupils in this sample have beaten their benchmarks; other pupils have fallen short. But the average – the overall school progress score – is 1.6, which means that pupils have exceeded their benchmarks by 1.6 scale points on average. This schools progress is, therefore, deemed to be above average. A negative score would be deemed below average, and a score of 0 would place the school right in the middle of the pack. It is important to note that a positive score does not mean that every pupil has done well just as a negative score does not mean all pupils have done poorly. And a 0 score could mean that all pupils have hit their respective benchmarks, or it could result from one half of the cohort far exceeding them and the other half falling well short. An average is just that: an average. It doesn’t tell the whole story.
We also need to consider the impact of those that are below the standard of the test and receive a nominal score based on their pre-key stage assessment. Due to the non-contextualised nature of the progress system, which can’t tell the difference between very different pupils who happen to have equally low start points (e.g SEND and EAL), it is often the case that pupils that do not sit key stage 2 tests end up with very low progress scores. We will return to this issue in a future blog post.
And then there is writing. Writing progress is the weirdest – and probably least reliable – school performance measure, and should be treated with extreme caution. This blog post takes a deep dive into the issues but – in a nutshell – just three pupils getting EXS instead of WTS in writing will increase a one form entry school’s progress score by a point. That’s easily enough to make the difference between an average and statistically significant result.
Statistical significance
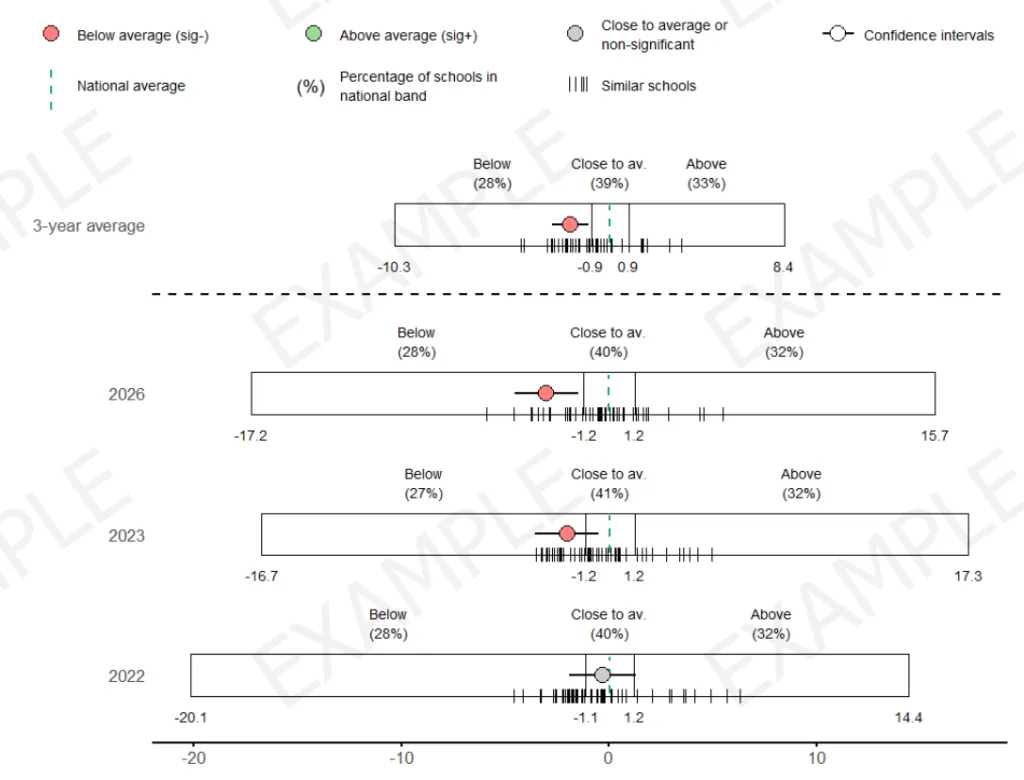
Once we have our overall progress score the DfE and Ofsted will work out if it is statistically significantly above or below average by slapping a confidence interval around it. These confidence intervals can be seen in the IDSR by clicking on the chart link below the data tables; in the DfE performance tables they are presented as a range. The bigger the cohort, the narrower the interval; the smaller the cohort, the wider the interval. This is intended to reflect the greater degree of uncertainty about the results of smaller schools due to the greater effect of one pupil on those results. If the confidence interval includes 0 (the national average) then progress is deemed to be in line with average; if the interval is entirely above 0 then progress is significantly above average, and if the interval is entirely below 0 then progress is deemed to be significantly below average. The following chart from the sample IDSR shows progress in 2023 and 2026 to be significantly below average because the confidence interval is below (i.e. to the left of) 0 – it does not cross the dotted green 0 line. In 2022, however, progress was just below but not significantly below average because the interval crosses the dotted green 0 line.
On the subject of performance bands…
In ASP reports and the school performance tables, the DfE sort primary schools into five bands based on their progress scores:
- Significantly above average and ~top 10% of schools (dark green)
- Significantly above average but not top 10% of schools (light green)
- Statistically in line with average (yellow)
- Significantly below average but not bottom 10% of schools (orange)
- Significantly below average and bottom 10% of schools (red)
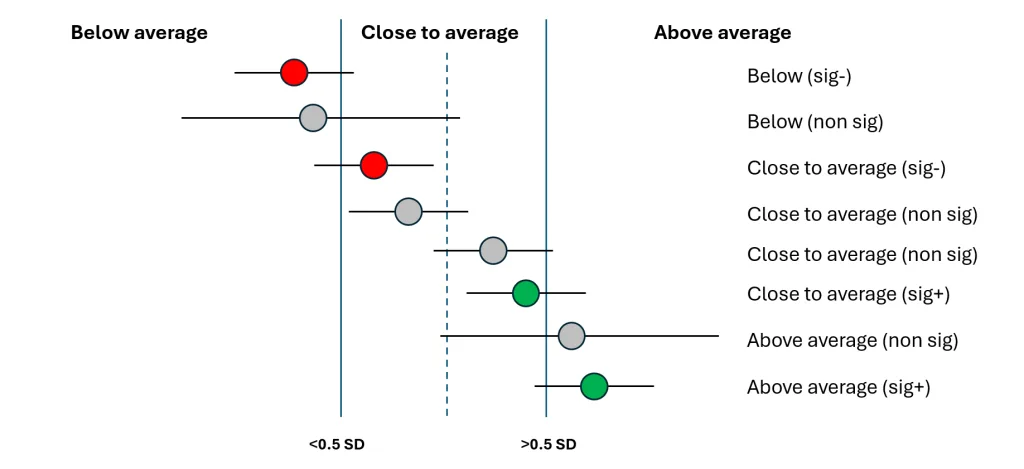
In contrast, Ofsted have taken two-stage approach in their IDSR reports. First, half standard deviations thresholds are used to sort schools into below average, close to average, and above average groups. Then a confidence interval is applied to establish whether the progress score is significantly above or below average. This results in some strange instances where a school is deemed to be close to average but also significantly above or below average. The diagram below shows each possible performance categorisation in IDSR.
And finally…
This is the last year of KS1-2 progress measures. The current year 5 cohort, who will take their KS2 tests in 2028, will have their progress measured from the reception baseline and, with the DfE keeping RBA scores under lock and key, we may never have the full details of the methodology. All-though primary schools will therefore have to navigate an opaque system of measures they can’t fully understand. Other types of schools, on the other hand – infant, first, middle, and junior – will be removed from the progress part of the accountability system entirely and will have responsibility for evidencing progress based on their own assessment information.
It might be a good time to rethink the whole system.
This post is part of our Autumn series of blog posts on progress which includes The Future of Progress, Making Progress in Primary Education, 2026 Value Added Calculator and Primary Accountability: navigating without a map.


Leave a Reply