At key stage 2, the national discussion is often focused on the number of children who are – or are not – reaching the expected standard. Whilst this is clearly of interest, what is happening within the two groups created by the expected standard is potentially much more interesting, as these two groups are evolving in ways that tell us quite a bit about what is happening in our primary schools.
We should start by understanding a little bit about the expected standard at KS2. When the latest iteration of the National Curriculum was introduced in 2014, a new method of making judgements about pupils’ absolute attainment came into place for the 2015-16 academic year. This is documented in the National curriculum test handbook: 2016 and 2017 Key stages 1 and 2 (available here) – pages 58-61 include details of the Bookmark standard setting procedure and the way in which standards were to be maintained over time. James Pembroke has written more about this here.
A key fact to note is that, by design, the expected standard in England effectively places children into two groups for reading, writing and maths: roughly 75% in a ‘successful’ bucket and 25% in an ‘unsuccessful’ bucket (writing is teacher assessed and has its own issues, which we wrote about here). In theory, all children could find themselves in the ‘successful’ bucket, but given the inherent limitations in the assessments used to place children in the reading and maths buckets, the patterns we see in each bucket and the design of the system itself, it is highly unlikely that we would – as we see when we look at the summary of national results in maths and reading since 2015/6.
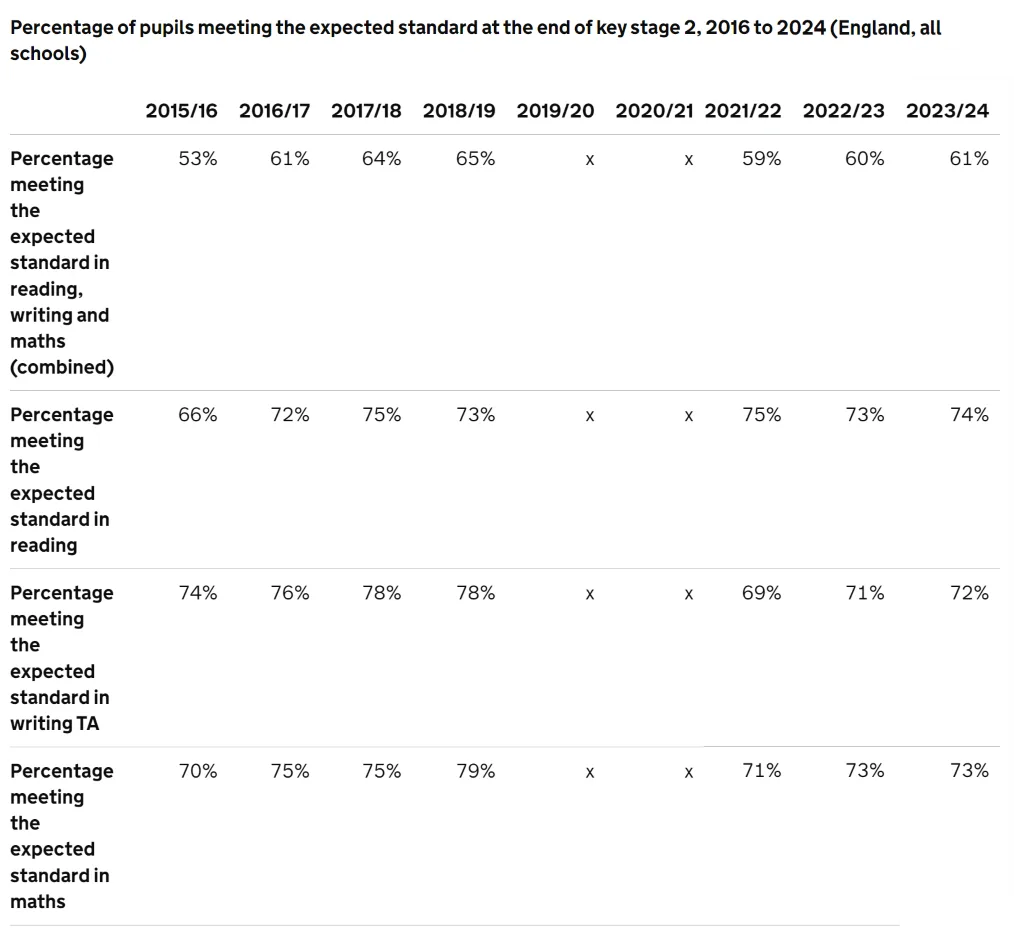
There are a couple of anomalies to mention. The 2016 reading test was generally held to be problematic, as news stories from the time suggest; since 2017, the percentage of children judged to have met the national expected standard has been between 72% and 75%. Writing is teacher assessed and therefore not given a great deal of weight in the system (Progress 8 does not use it, for example). The expected standard in Maths has fluctuated between 70% and 75%, with the year immediately pre-pandemic being unusual (79% having reached the expected standard in that year).
Here, we will focus on Reading and Maths, as both of these are assessed using rigorous standardised tests, about which the government publishes a great deal. The raw scores are converted onto a scale (from 80 to 120 with 100 as the expected standard) which in theory makes comparisons between assessments more meaningful. It should be remembered, however, that the maintenance of standards is given priority by the Department for Education (DfE). The DfE also has control over the conversion tables, which makes the interpretation of distributions of scaled scores difficult.
So, whilst the raw score selected as the cut-off for the expected standard fluctuates, as can be seen in the table below, the percentage reaching that standard remains (by design) largely static.

The distributions of the raw scores are interesting, however. The items selected for the test range in their facility – how difficult they are – so that the tests can differentiate between candidates. By design, the spread in difficulty should not vary a great deal year on year. Whilst the expected standard is decided with reference to the outcomes of the assessment and the original bookmarking of the 2016 series, there are still a range of items with increasing difficulty.
The distributions of the raw scores each year give us an indication of children’s changing ability to answer the questions on the tests over time.
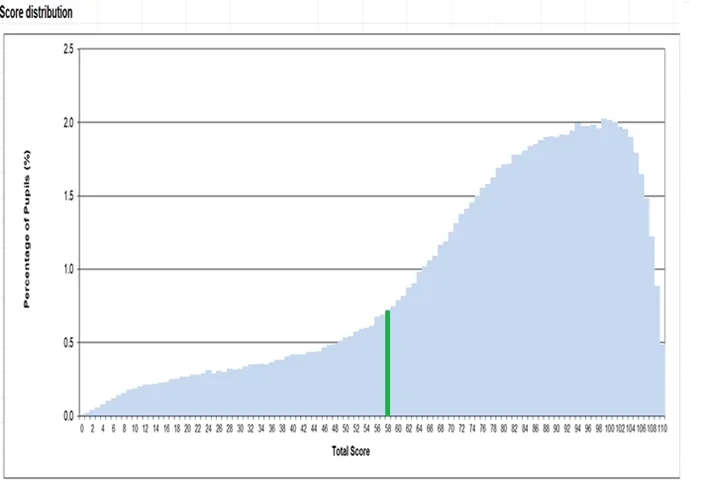
The graphs below are published a year or so after the assessments are taken in the Technical appendix of the National curriculum test development handbook. Here, for example, is the distribution of the first set of Maths raw scores in 2016:
2016 Maths Raw Scores – 70% reaching expected standard
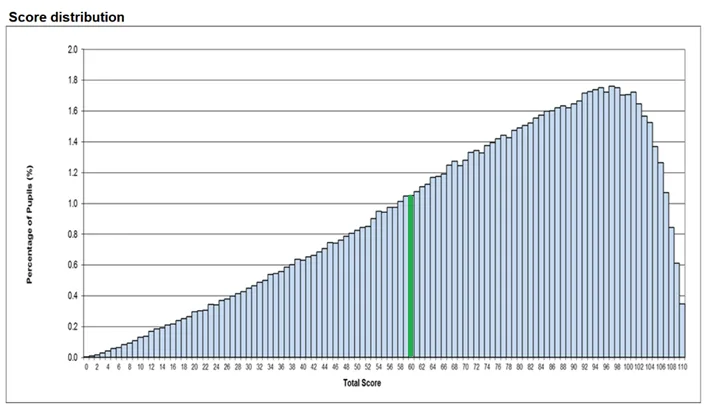
Interpreting these graphs is tricky. In general, sections with a steeper positive gradient suggest that scoring additional marks is easier than in sections with a shallower positive gradient. Where the gradient is negative, scoring additional marks is hard; the steeper the gradient, the harder additional marks are to get.
In 2016, scoring additional marks was generally consistently difficult for the first 95 or so marks, after which it became more difficult to score additional marks.
The cut-off for the expected standard, which was 60 marks (out of 110) in 2016, is marked by the green line. 70% of pupils were in the ‘successful’ bucket and 30% were in the ‘unsuccessful’ bucket.
The inherent limitations in these kinds of assessments were mentioned above – these include, amongst others, a degree of inherent measurement error and having to treat raw marks as if they all have the same value. The cut off of 60 marks will include some false positives and false negatives, and the makeup of an individual’s 60 marks may vary when compared to others.
For the ‘successful group’, there are clearly a number of questions aimed at differentiating between the most able mathematicians – it is clearly increasingly difficult to score the last ten marks. It’s also clear that there is a steady increase in the percentage of students getting a particular raw score until the mode score of 96 out of 110.
In the ‘unsuccessful group’, there is a steady increase in difficulty and discrimination (as there is for those in the lower part of the ‘successful’ group). For those at the lower end of the distribution, who scored very few marks on each of the three tests used in the assessment, sitting the papers will have been a disheartening experience.
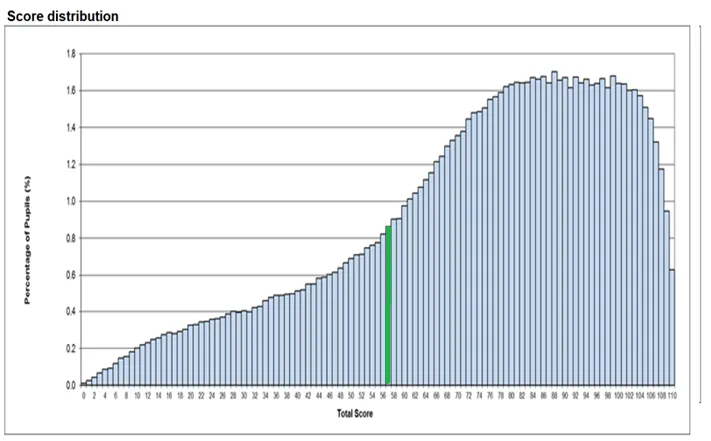
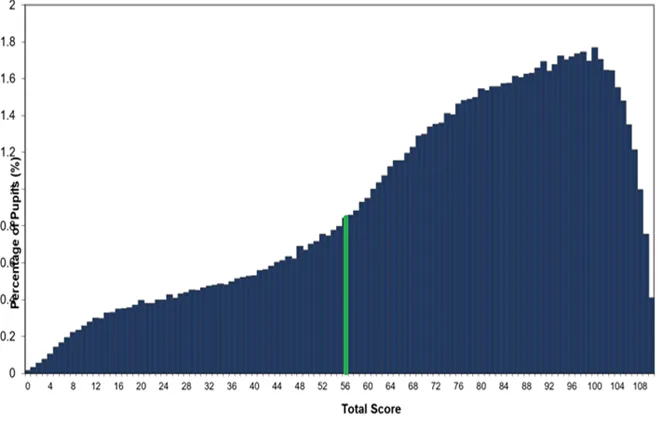
When you consider the patterns in different assessments designed in the same way, such as these from 2017, 2018 and 2019, some interesting patterns emerge.
2017 Maths – 75% reaching expected standard
2018 Maths – 75% reaching expected standard
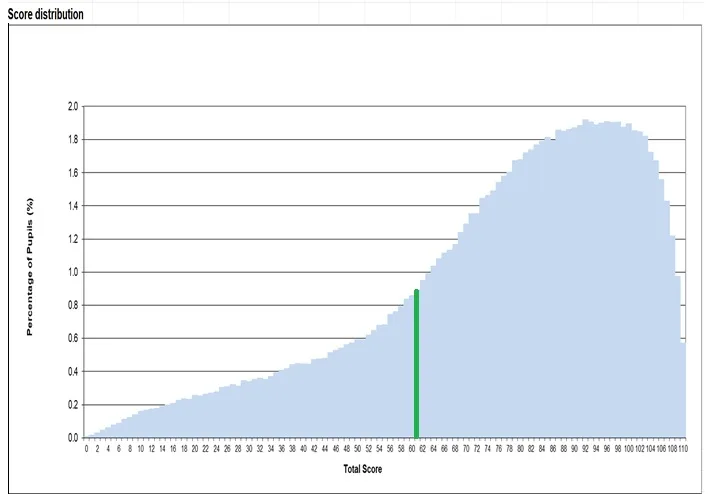
2019 Maths – 79% reaching expected standard
If we focus on the ‘successful’ bucket, we can see the distribution bunching up towards the right-hand side of the graph. In this bucket, pupils are getting better at scoring high marks on the test. Since the cohorts are independent of each other, this probably suggests that either pupils are becoming more able as a group or that schools are getting better at helping pupils to be successful on the tests.
In the ‘unsuccessful’ bucket we see a different pattern. In 2017 and 2019, where pupils are scoring fewer than around 40 marks, gaining the additional marks in the initial stages seems to be slightly easier than doing so in the section leading up to 40 or so marks. There is a bunching to the right in those scoring between 40 and the expected standard, as adding additional marks becomes easier for those scoring in this range.
The effect is less pronounced in 2018, although the general move towards higher scores in the successful bucket is clear.
The move post-pandemic is equally pronounced, with the ‘unsuccessful’ group tending left and the ‘successful’ group tending right in comparison with pre-pandemic outcomes. This is more pronounced in 2022 than 2023, which may reflect the decisions made by test setters having to make assumptions after two years without any key stage 2 data.
2022 Maths – 71% reaching expected standard
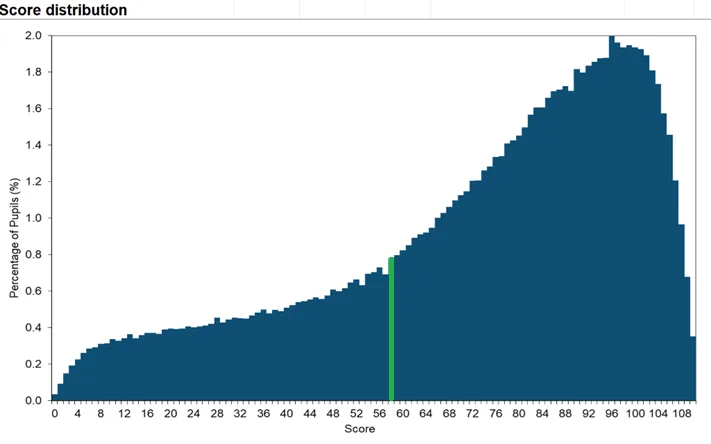
2023 Maths – 73% reaching expected standard
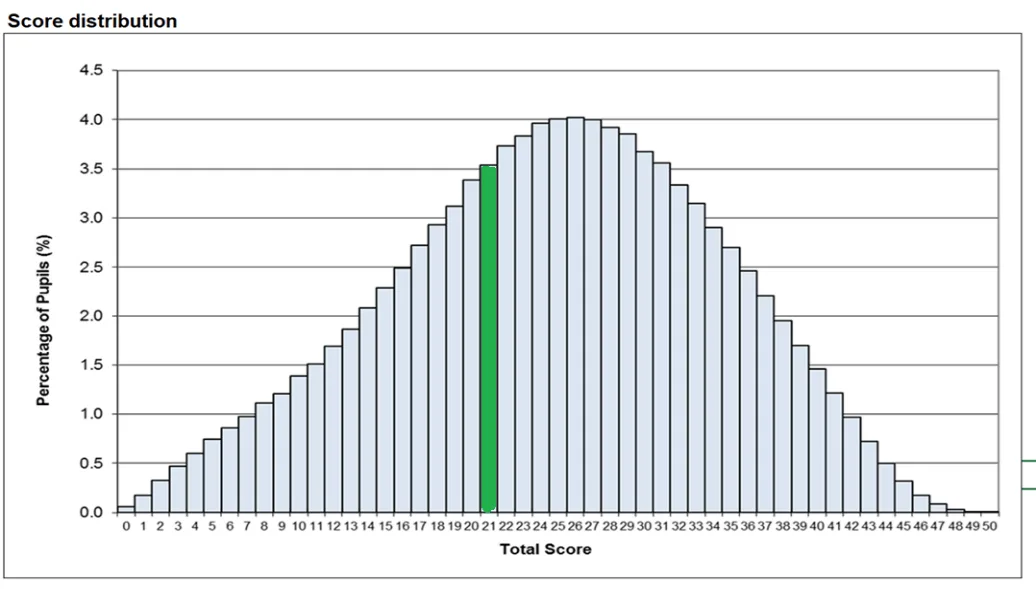
The pattern in Reading is equally interesting. 2016 had a remarkably normal distribution of raw scores, which is unusual in test design – most primary assessments are set such that most pupils get more questions right than they get wrong. My suspicion is that those setting the expected standard overestimated the ability of Year 6 pupils in this first year of the new assessments.
2016 Reading – 66% reaching expected standard
It appears the Expected Standard was reset in the years after 2016 test, as the 2017, 2018 and 2019 look much more accessible for pupils. Even so, the mode score was 37/50 in 2017 (compared to 26/50 in 2016) with a rapid drop in the numbers of pupils recording scores above 40. In 2018 and 2019 the higher-scoring trend continued, as more pupils appear to the right of the distribution.
2017 Reading – 72% reaching expected standard
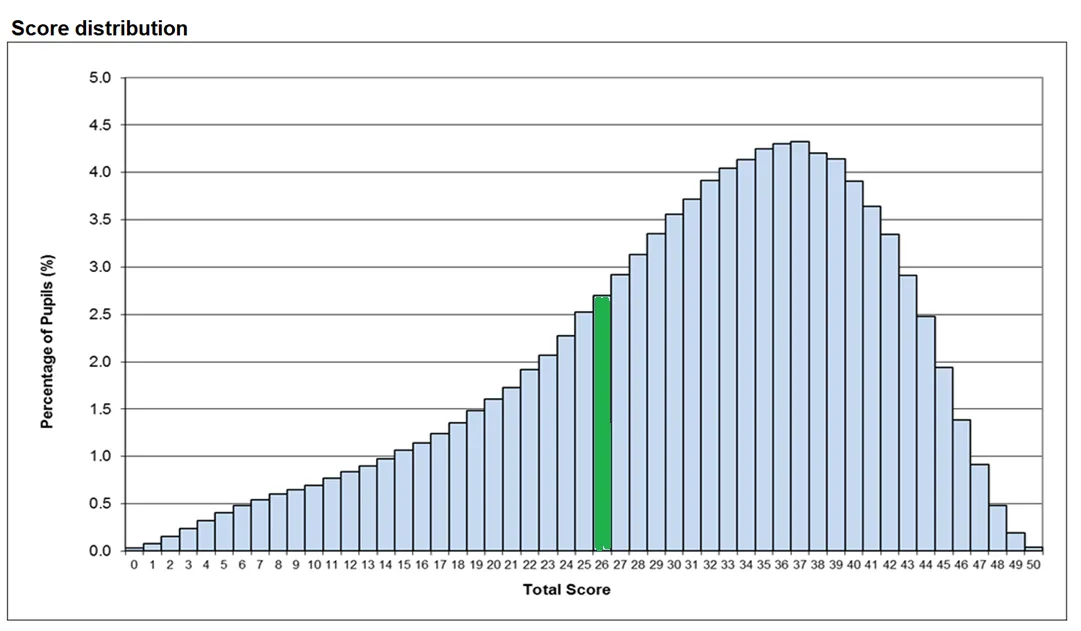
2018 Reading – 75% reaching expected standard
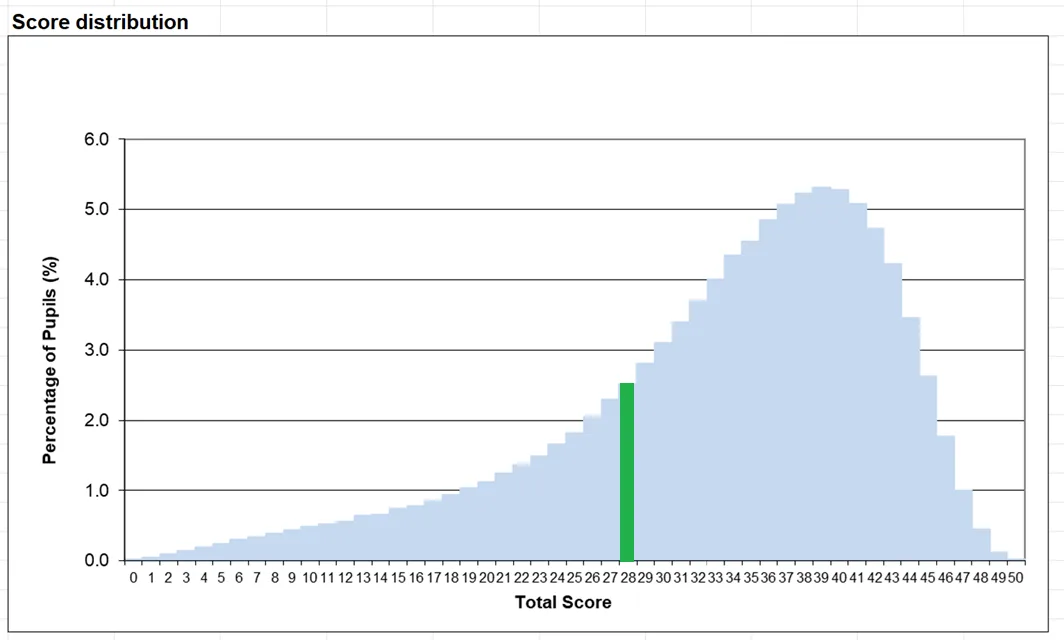
2019 Reading – 73% reaching expected standard
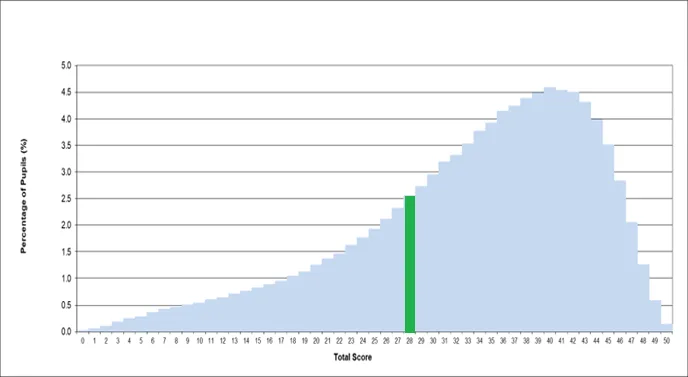
This trend continued after tests resumed in 2022, although by 2023 (taken by pupils who were in year 3 when schools closed in 2020) there was a move back towards lower scores.
2022 Reading – 75% reaching expected standard
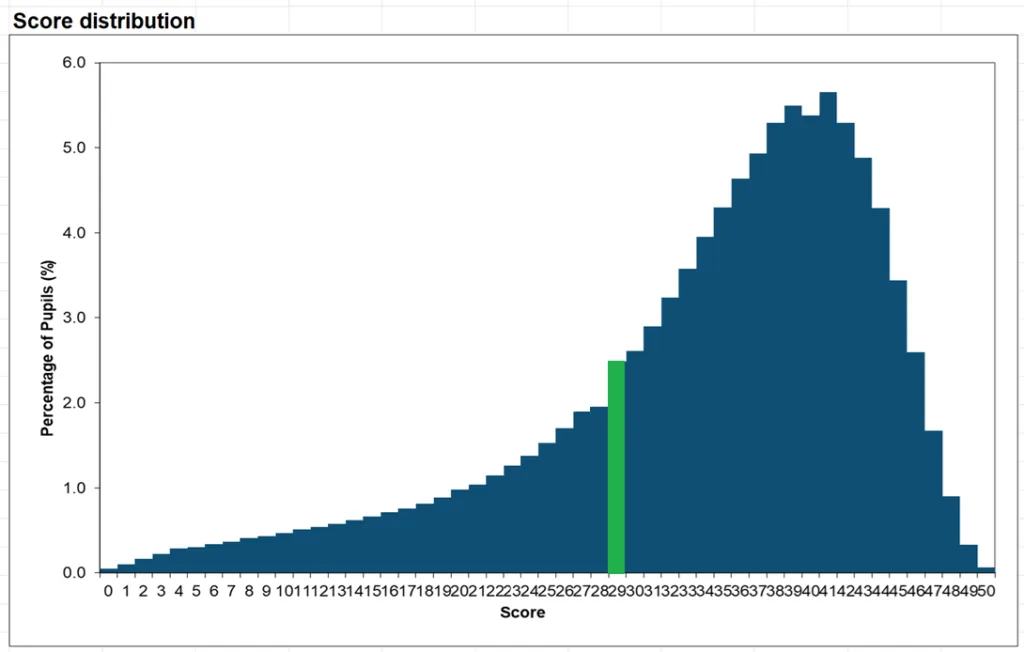
2023 Reading – 73% reaching expected standard
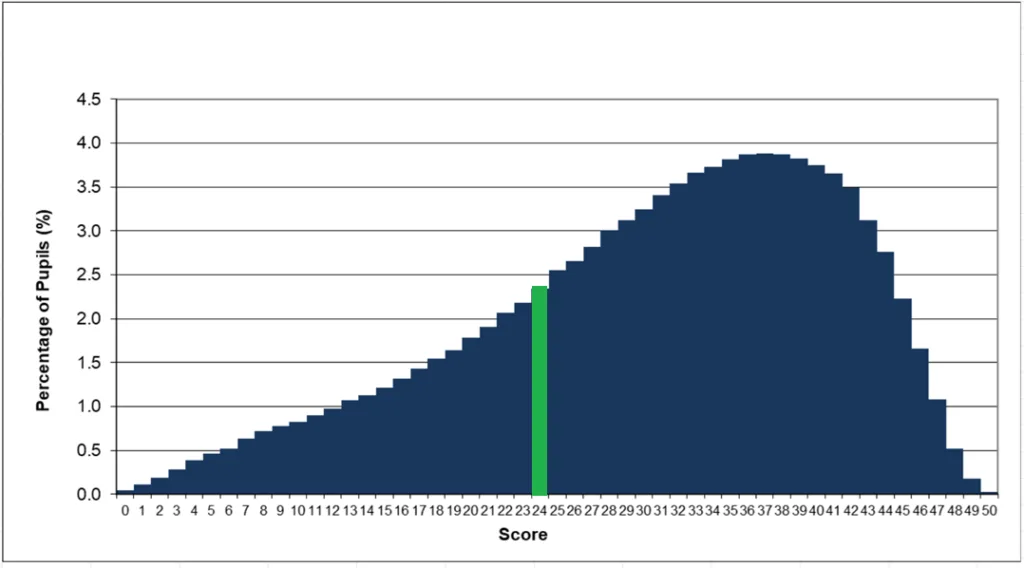
In summary, whilst the numbers of pupils reaching expected standard doesn’t tell us too much about what is happening in schools by design, the distributions of raw scores appears to tell us quite a bit about both pupils’ experiences of the academic expectations at the end of key stage 2 and the underlying trends in how schools are working to enable pupils to access the end of key stage 2 assessments.
For those in the successful bucket, school is increasingly becoming a place where they experience success, as they learn what is expected of them in maths and reading and find the assessments they are asked to complete increasingly accessible. Schools must take some of this credit, as each successive ‘successful’ cohort appears to be becoming ever more able to score well on assessments. For those in the unsuccessful bucket, maths is either something they are getting gradually better at or – more worryingly – something which is increasingly less accessible. For large numbers of pupils – particularly but not exclusively in the unsuccessful bucket – reading is proving to be trickier than it was pre-pandemic.
Compared to 2016, however, it appears that even with a system which is designed to maintain standards over time, we have two distinct groups of pupils – those who are experiencing more success and those whose experience of school are likely to be much more mixed.
Are you interested in exploring the current state of data in schools and finding out what works and what doesn’t? Join us at one of our 2024-25 Data in School Conferences
“I thought it was brilliant! I got home and did a SWOT analysis of assessment in our school to help focus where we are and where we need to go next. I just wish all the leaders in my Trust could’ve been there.” (attendee of DISCO Solihull, 23 Nov 2023)

Leave a Reply