
In my last post, I looked at the legacy of RAISEonline and how reports of 100 or more pages in length came to be seen as normal – essential even. But in recent years, we have seen a major shift in approach to school performance reporting and, in its most recent iteration, Ofsted’s Inspection Data Summary Report (IDSR) is just a few pages long, much of which is devoted to school and pupil context. The small amount of space devoted to academic standards is an indication of the limitations of the data. Only the results that are deemed to be significantly above or below average are displayed by default; other results can be revealed by clicking on a ‘non-significant data’ link. And in the pupil groups section, due to the often small number of pupils involved and the consequent uncertainty around the data, audiences are frequently confronted with a ‘no pupil groups were highlighted for this school’ statement. Boring, maybe, but a far better approach than the RAISE-style publishing of tables and tables of data broken down into every conceivable sub-group of pupils regardless of whether the data is meaningful or not. Sometimes, more is less.
As far as governors are concerned, they definitely need to have sight of the IDSR, and will probably need some training to understand it. Do consider, though, that the IDSR is a fairly straightforward document and a one-hour online training session should be sufficient. You may decide to supplement the IDSR with data from the Analyse School Performance (ASP) system but bear in mind that ASP has inherited the DNA of RAISEonline: results – including those of numerous pupil groups – are presented whether they are statistically significant or not. Interpretation is therefore highly subjective and can lead to misjudged conclusions and priorities. Often what appears to be high or low performance is merely statistical noise.
Beyond the IDSR, there are four key pieces of information your governors need: attendance, context, results over time, and a summary of current assessment. Below are examples of these taken from the Insight system.
Attendance
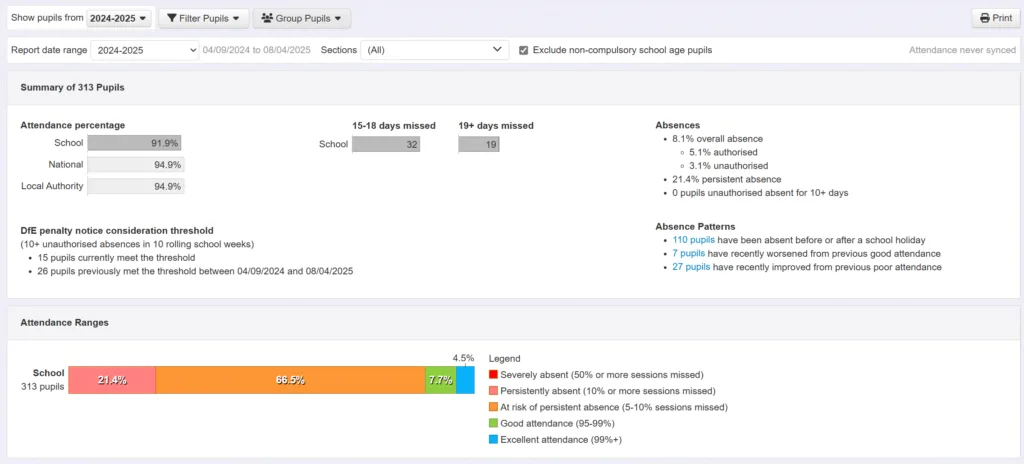
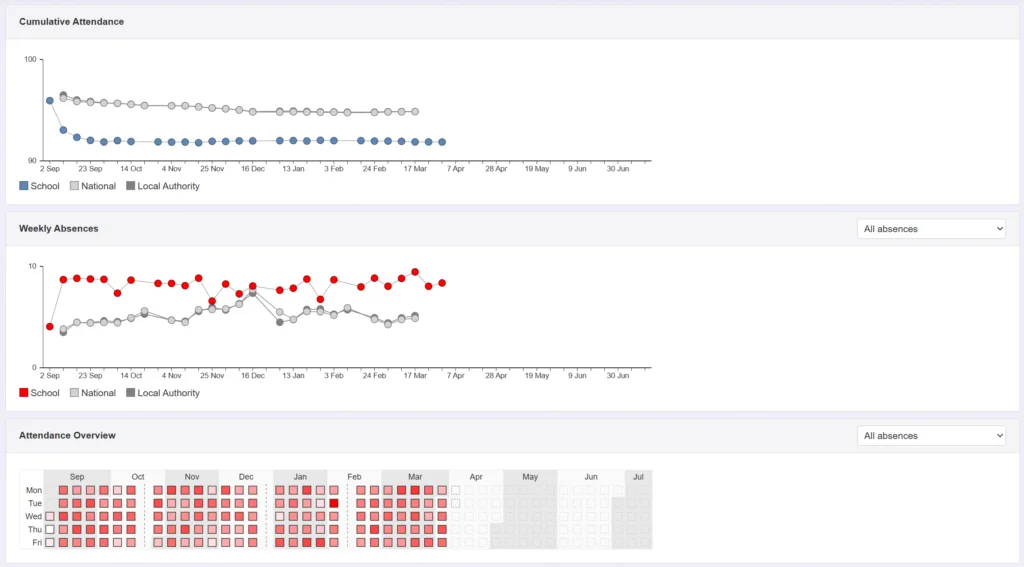
With concerns about persistent absence growing since the pandemic, attendance is understandably a hot topic and something governors need to keep tabs on. We can start by providing a simple summary of attendance over time – the percentage of sessions attended – broken down by year group. This will allow governors to ask some questions about variations in attendance across cohorts. But a more detailed report will enable them to understand the intricacies and patterns of attendance. Are pupils missing school due to illness or unauthorised holidays? How many pupils are at risk of persistent absence? Are pupils meeting the DfE’s penalty notice threshold by having 10 or more sessions of unauthorised absence in the last 10 weeks? Insight’s attendance report provides this information alongside other important attendance-related metrics.
Context
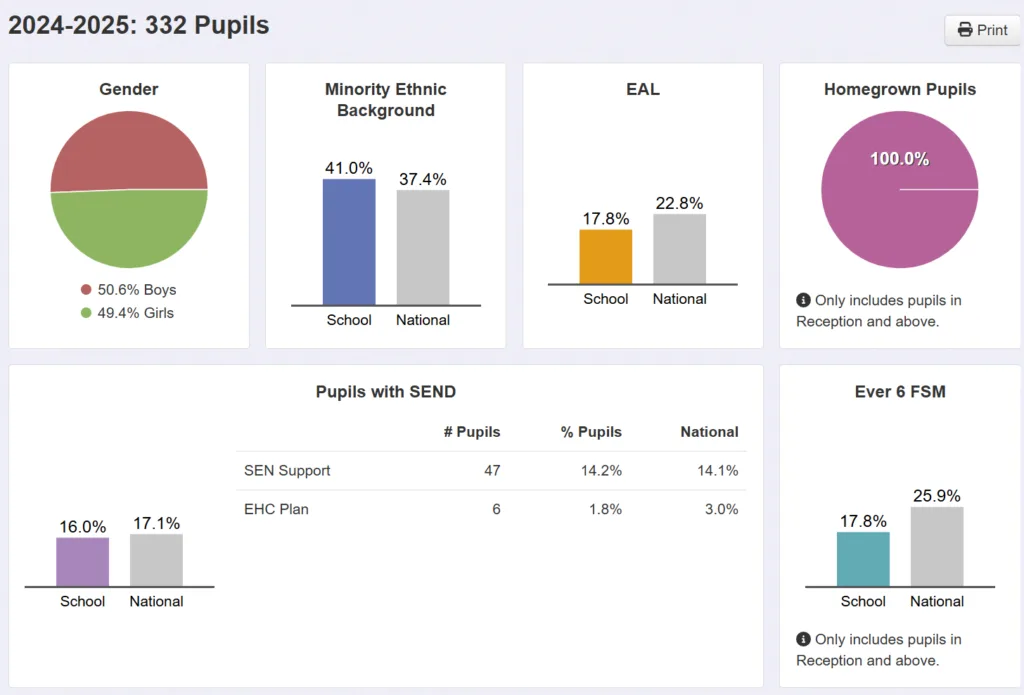
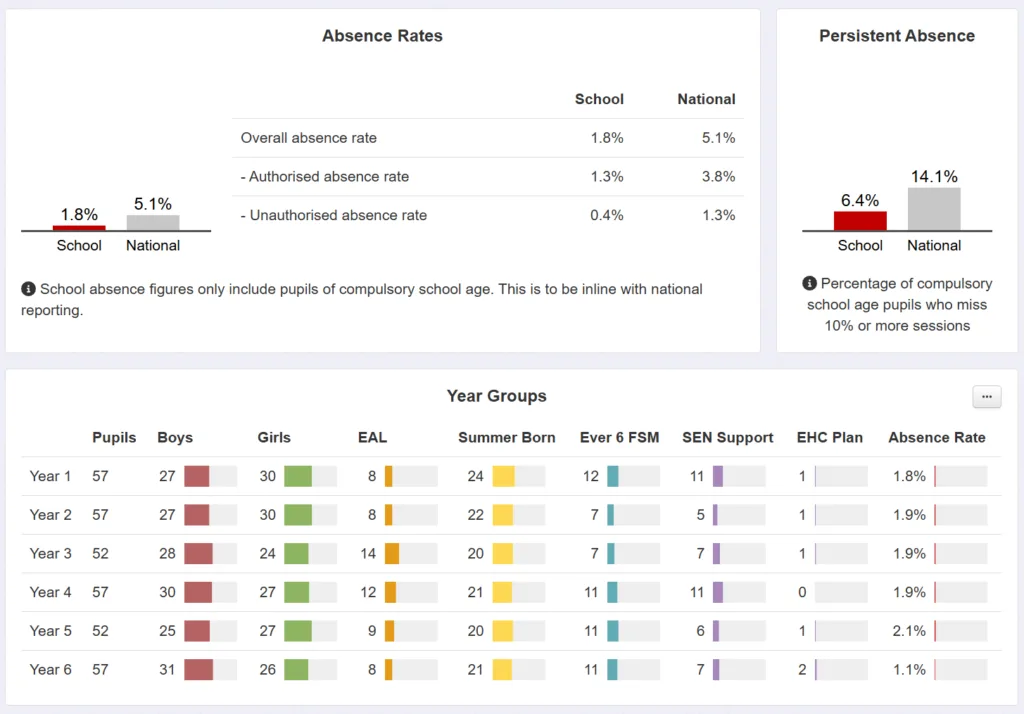
In-depth knowledge of school context is obviously vital for all governors. Knowing the key issues facing the school will help anticipate – and understand – changes in results, and ensure that resources are being directed appropriately. Insight’s demographics report provides governors with a clear overview of the school population; and the breakdown by year group highlights cohort-specific challenges. It is especially important that governors have a keen understanding of SEND: the different types of needs, what is being done to address them, and how needs are changing and evolving over time.
Results
To investigate whether academic standards are improving or not, governors will need a summary of the results of statutory assessments over time. Analyse School Performance contains much of the data, but it’s difficult to access trends, and ASP no longer contains key stage 1 or EYFS results. Something like Insight’s statutory assessment report is ideal.
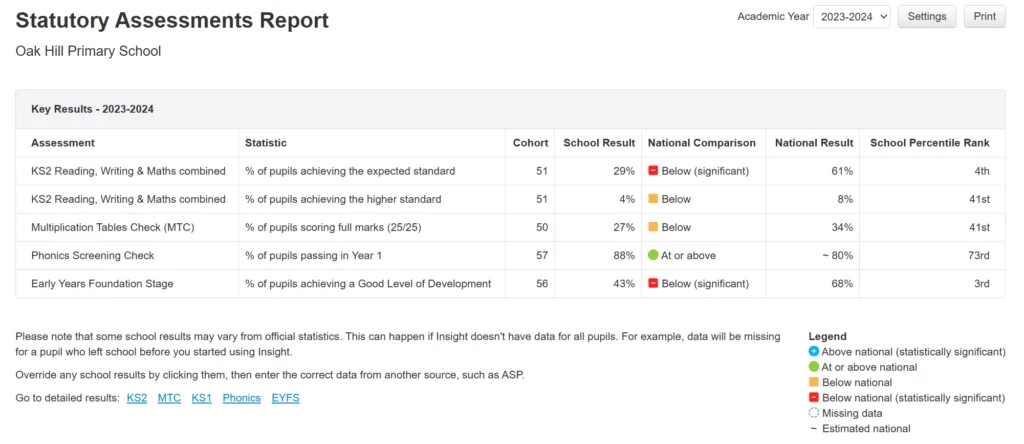
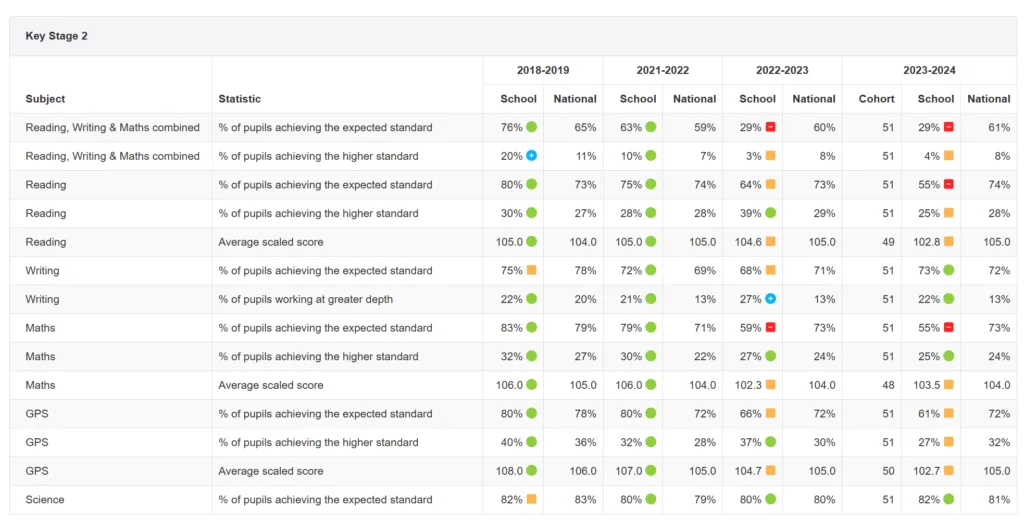
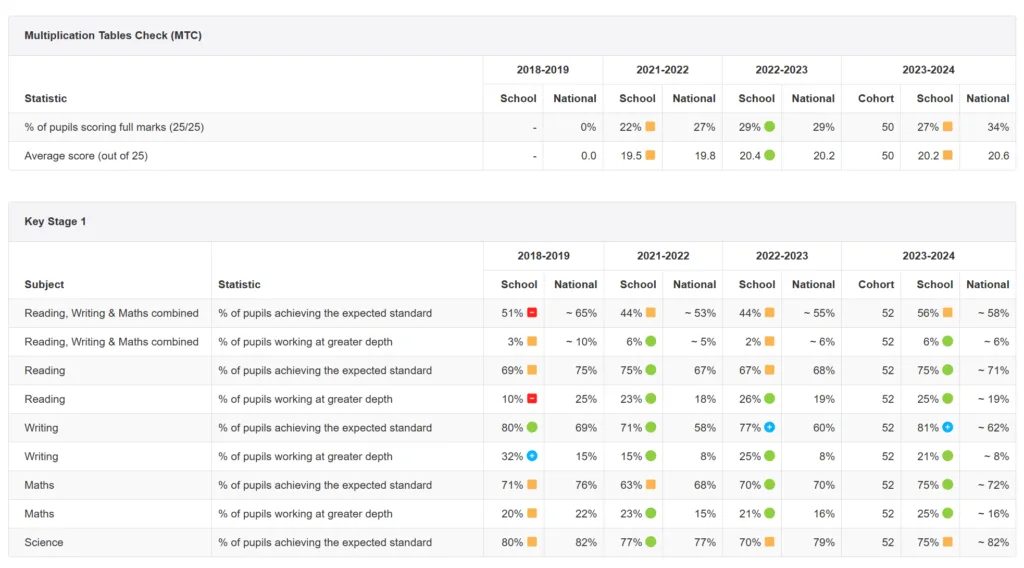
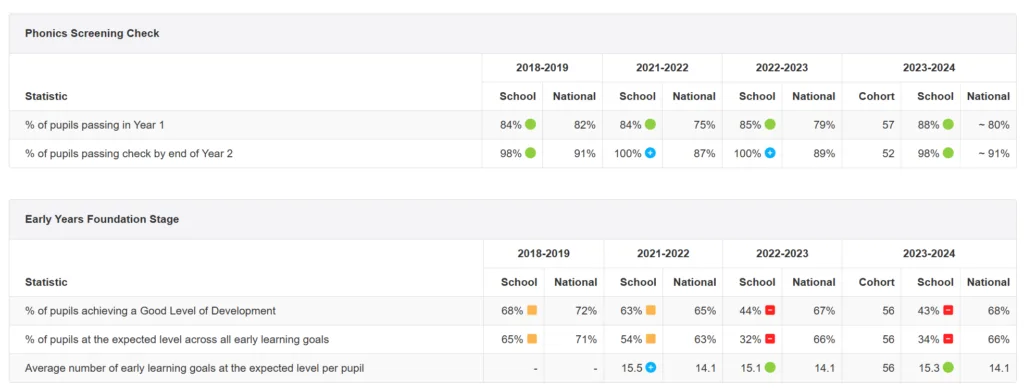
In this report, the last four results for KS2, MTC, KS1, phonics and EYFS are presented and colour-coded according to whether they significantly above, in line with, just below, or significantly below national average. Percentile rank adds further information on a school’s position in the national context.
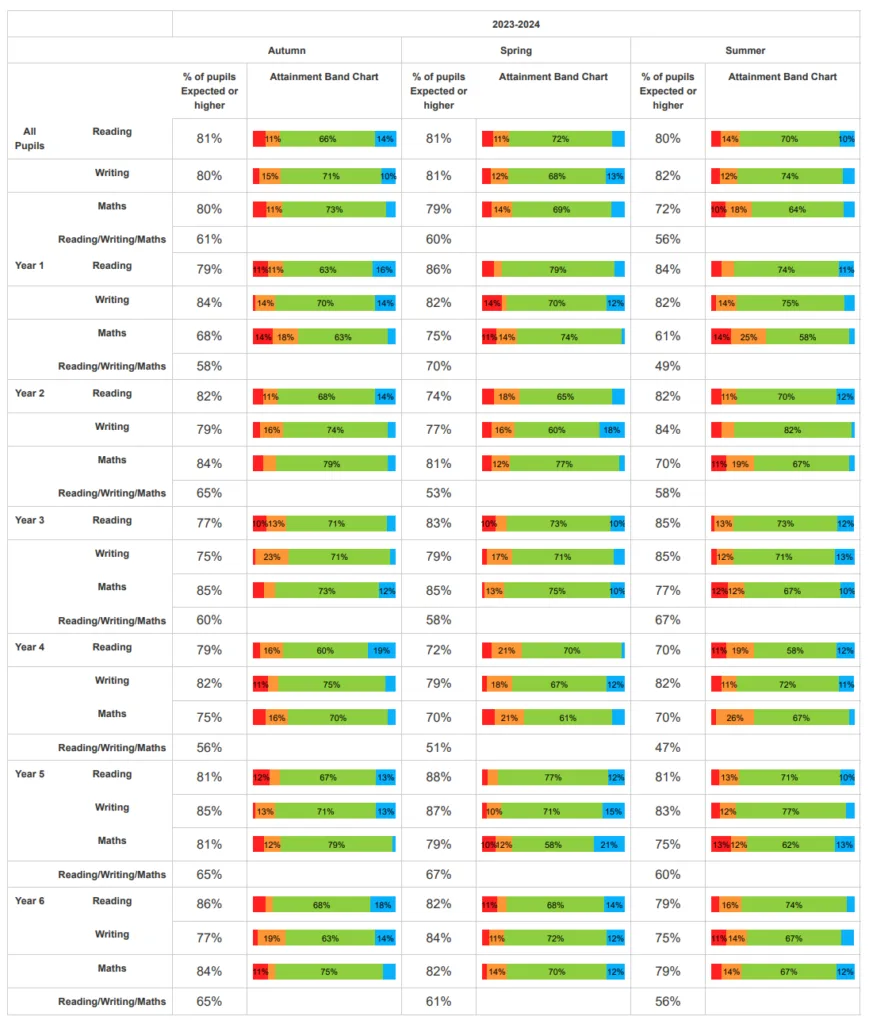
Assessment
The last key piece of the jigsaw is a summary of current standards across the school – where pupils are now in their learning; how secure they are in the curriculum. In a primary school, data should focus on reading writing and maths, and should be attainment-based. Avoid abstract progress measures, which convey little real information and have nothing in common with the DfE’s ‘official’ progress scores. Simply present percentages of pupils working below, at, or above expectations in core subjects. Governors can then focus their questions on, for example, why there is a particularly high proportion of pupils working below expectations in maths in year 1, or why there is a decreasing percentage of pupils working above expectations in year 6. Beyond that, conversations should move on to the support that is in place to help pupils overcome barriers to learning. The following Insight headlines report provides sufficient information to facilitate these conversations.
RAISEonline casts a long shadow, and there is a tendency to believe that more data is better; that governors require vast amounts of information to perform their duties of monitoring, challenging, and holding leaders to account. But the law of diminishing returns applies: the more data we supply, the more we risk losing sight of the whole, and the more likely we are to end up with misplaced priorities based on unreliable information. Unlike engineering, where numbers are the output of highly calibrated machines and tolerances are tight, assessment is noisy and the margins of error are large. There are no SI units in education.
Governors need information but a deluge of data is counterproductive. Beyond the IDSR, a summary of context, demographics, results, and recent assessments outcomes is all that’s required. This will lead to some tricky conversations, especially if governors are used to data being split into numerous pupil groups. Yes, governors have a duty to monitor the attendance and educational standards of all pupils – especially the most disadvantaged – but we have to concede that averages and percentages are meaningless when we are dealing with small groups. And it is at this point that conversations take over.
Often in education, narrative beats numbers.
Leave a Reply