
We are often asked whether there is a connection between the raw scores recorded in the Year 4 Multiplication Tables Check (MTC) and scaled scores recorded two years later in the key stage 2 Maths SATs. One regular question is whether the MTC has any predictive power for KS2 results. The answer for most pupils is no, although those who find maths difficult tend to find times tables difficult too.
The distributions of the two sets of scores give a good indication as to why there is no clear connection between the two scores. We use data from 75,631 pupils whose scores on the 2022 MTC and 2024 KS2 Maths are recorded in Insight.
MTC scores
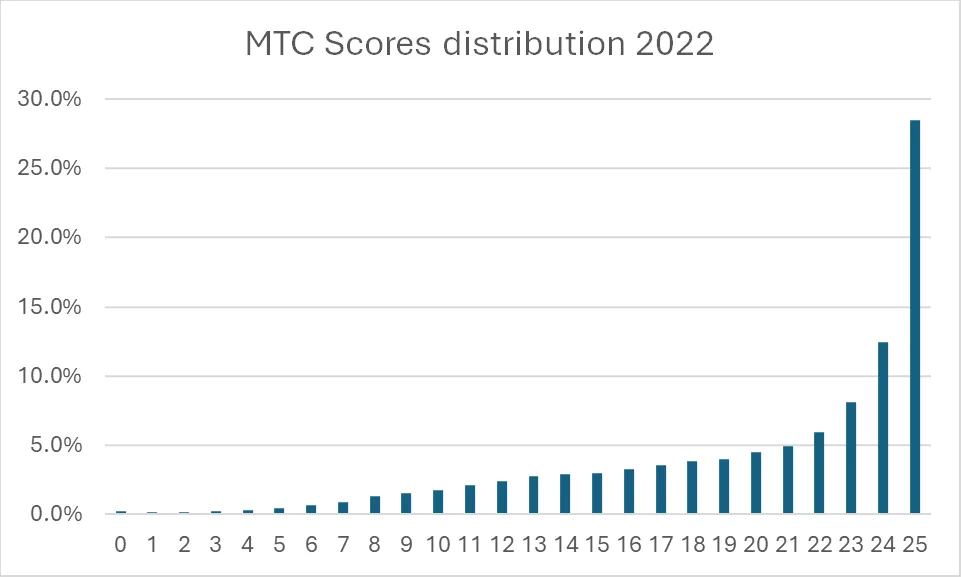
As can be seen here, 28% of our sample achieved full marks. This is in line with the national average of 27% in 2022. The median score of our sample was 22 and the mean score was 20.1.
This data is clearly heavily skewed to the right, indicating that there is a strong ceiling effect; the MTC is not able to distinguish between the more able mathematicians scoring full or close to full marks. Over 50% of the pupils score one of just four possible scores (22, 23, 24 or 25). 79% of the pupils score 15 or over. Very few pupils score less than 7.
The MTC, taken in Year 4 in the first two weeks of June each year, was introduced in the 2021/22 academic year. Whilst there is no pass mark, the percentage of pupils scoring 25 out of 25 is reported each year. Since its introduction, 25/25 has been the mode score, with the percentage of pupils scoring full marks increasing over time.
KS2 Maths scaled scores
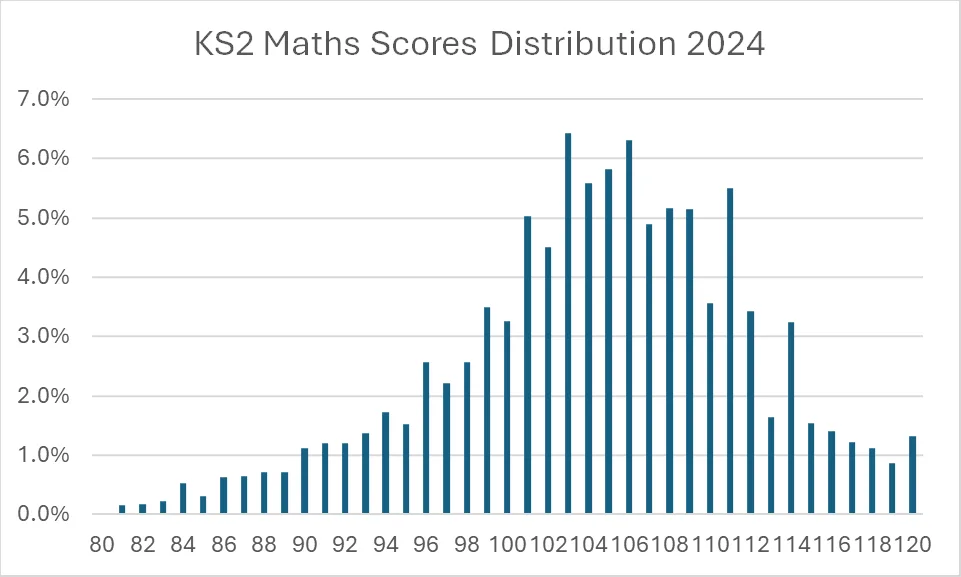
This data is slightly skewed to the right, with some ceiling effect which means that the most able mathematicians are grouped together with a scaled score of 120. Whilst scaled scores are created in a somewhat opaque manner, the expected standard is set at 100, with roughly 75% of pupils scoring above this score.
In our sample, the median score was 105 and the mean score was 104.4.
Connections between the two scores
One way to assess the strength of any connection is to look at ‘correlation’. Correlations range from -1 (perfect negative correlation) to +1 (perfect positive correlation). A strong correlation suggests that most pairs of observations are relatively close to a line of best fit for the two sets of data; it does not imply any direction of causation, or even any inherent causation.
For our sample of pupils who took the MTC in 2022 and the KS2 Maths SAT in 2024, the correlation is 0.62. This indicates a moderate relationship. Those who score well in their KS2 Maths are likely to have recorded high scores on their MTC; those who scored below 15 on the MTC are likely to have scored below 110 on their KS2 Maths.
Another ‘line of best fit’ uses regression analysis to visualise the strength of the connection between the data sets. A scatter plot with a line of best fit based on regression looks like this:
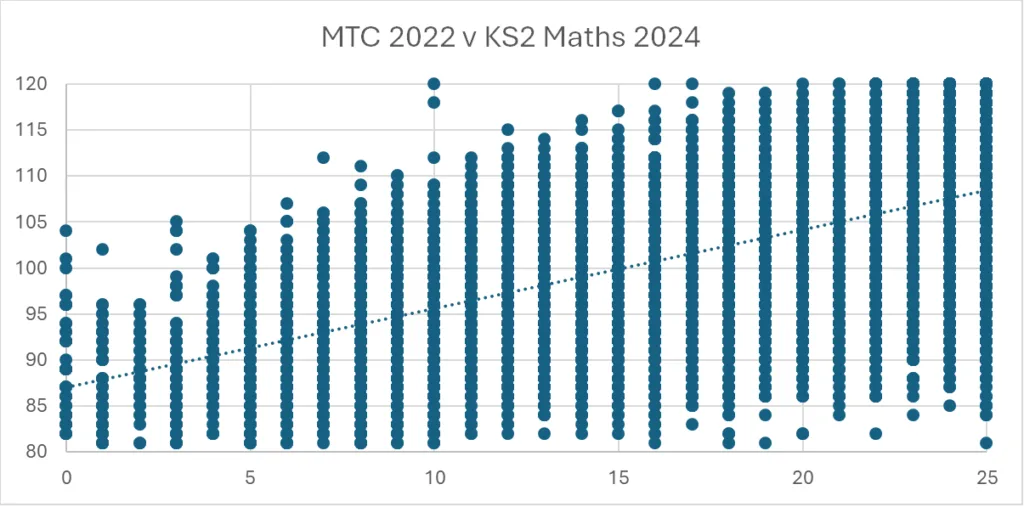
For most of the higher MTC scores – remembering that over 50% of candidates scored the top four possible scores (22-25) – almost any KS2 Maths outcome is possible. The 21% of pupils who score less than 15 on the MTC do not tend to score the highest scores in KS2 Maths, but do record a wide range of KS2 Maths scores.
The biggest issue we face when look at whether there is a connection between the raw scores recorded in the MTC and scaled scores recorded two years later in the KS2 Maths SATs is the simple observation that the MTC does not differentiate particularly well between candidates.
It is worth noting that there will be some degree of measurement error in both assessments as well, which further weakens any connection between the scores.
The most we can say is that, at population level, lower scores on the MTC (or in KS2 Maths) appear to be related to lower in KS2 Maths (or the MTC).
The nature of the MTC means that it has very little predictive power for the majority of pupils. Those who struggle with times tables knowledge also struggle with maths more generally.
Leave a Reply